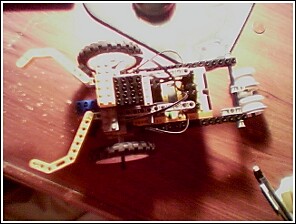
I’ve reached that point now where so many things are coming together that I’m going out of my mind with excitement. In truth I haven’t accomplished MUCH more in the last few days than I have during the rest of the project, but with the graphical view of the neural net, I’m really seeing it come alive like I never have before, and it’s just amazing. More pictures today.
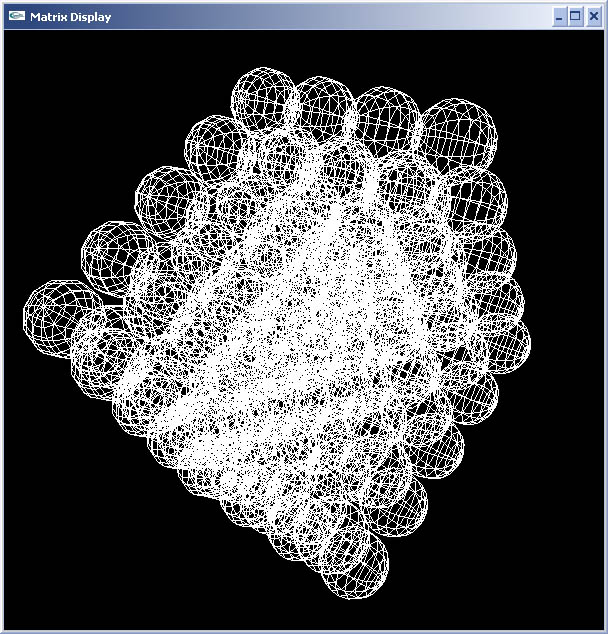
First off, I played around a bit with generating a larger matrix and adjusting threshold and weight values. Here is a 3000 neuron matrix I generated for Milo
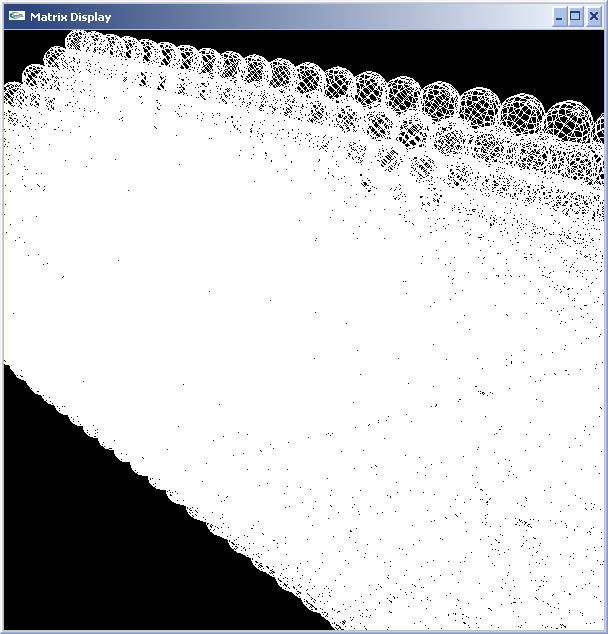
Really beautiful to watch something of that size spinning around in front of you. I added code that allows you to adjust the distance from which you view the neural net – not a big deal, but nice for ease of viewing.
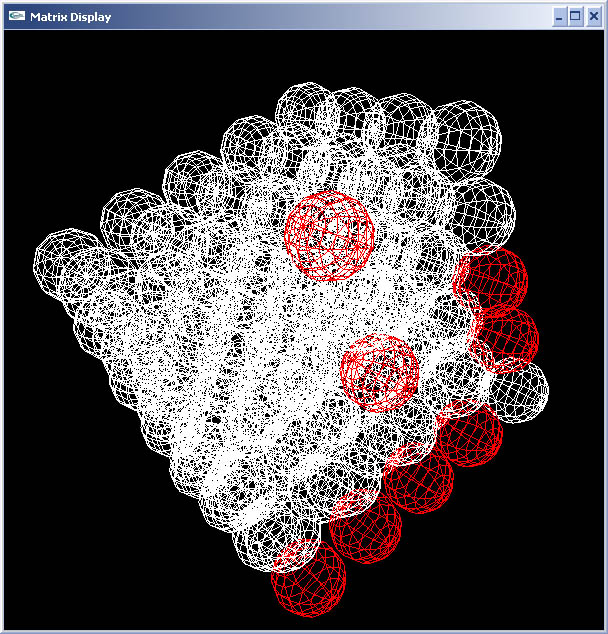
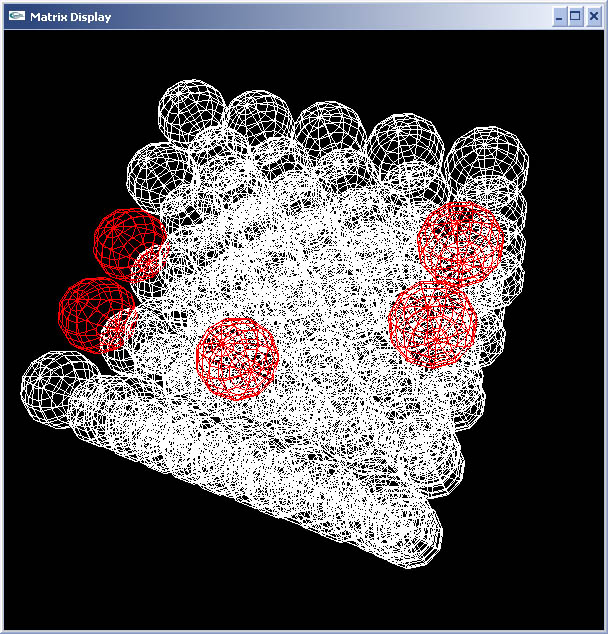
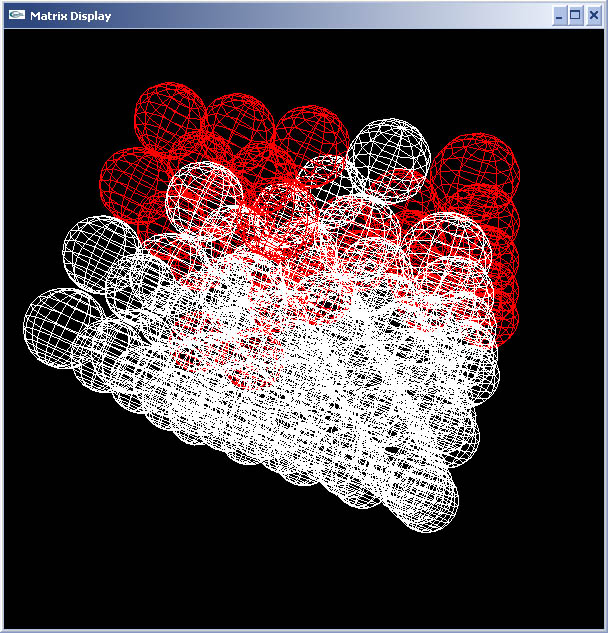
I also wanted to test my theory about the current synaptic modification functionality leading to cascade overload in the net. I generated a 1000 neuron brain for milo, connected Milo’s touch sensors to 4 input neurons in the corner region, increased default synaptic weight across the net to speed up the process, turned it on, touched Milo’s antenna, and BOOM, one massive (and deadly if biologically experienced) seizure:
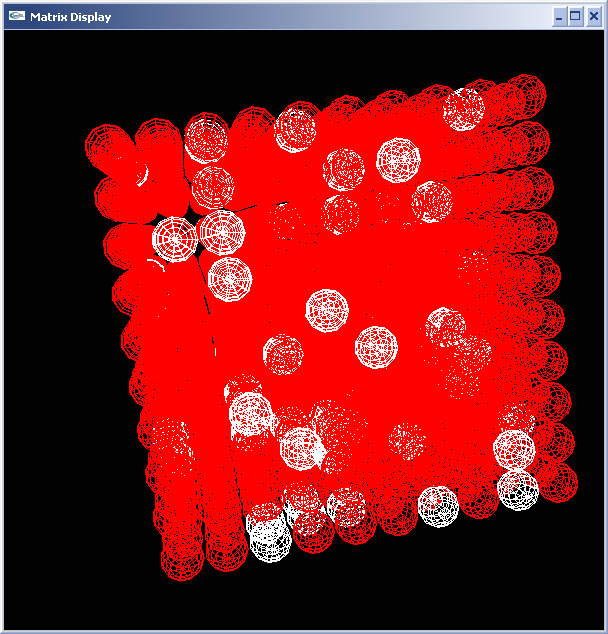
It was amazing, at one point just the local region to the input neurons were active. Then 25% of the net, then as neural pathways looped back and synaptic strength was increasing, 50% of the net was active, then 75%. After 30 seconds or so there were maybe 1 or 2 orphan neurons that weren’t active, but that was it. Definitely proved the fact that the current synaptic modification code is wrong and needs to pattern Hebbian Learning.
Tonight I finished the code that displays synaptic links between the neurons. From the visuals you can’t tell which is the presynaptic neuron and which is the post, but this isn’t TOO too important when viewing in this scale anyway. What it does tell you is the strength of the synapse from the color. A greener synapse means a weak link, while a bluer synapse means a strong link. Here is a picture of a 100 neuron matrix at rest with random synapses assignment:
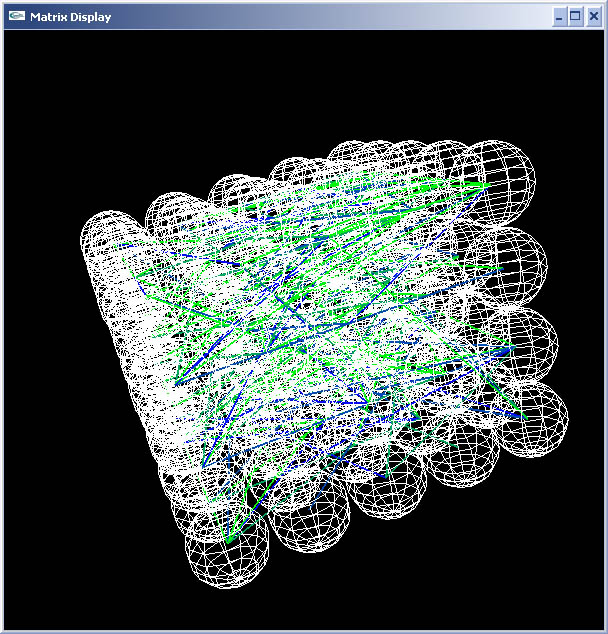
The great thing is, I was finally VISUALLY able to test out the global synapse degradation scheme. I jacked up the time frame so the synapses degraded much more quickly than normal, turned the brain on and let it just sit, with no input being fed into it. I slowly watched as strong synaptic links weakened over time into green links due to lack of exposure to “virtual neurotrophins”.
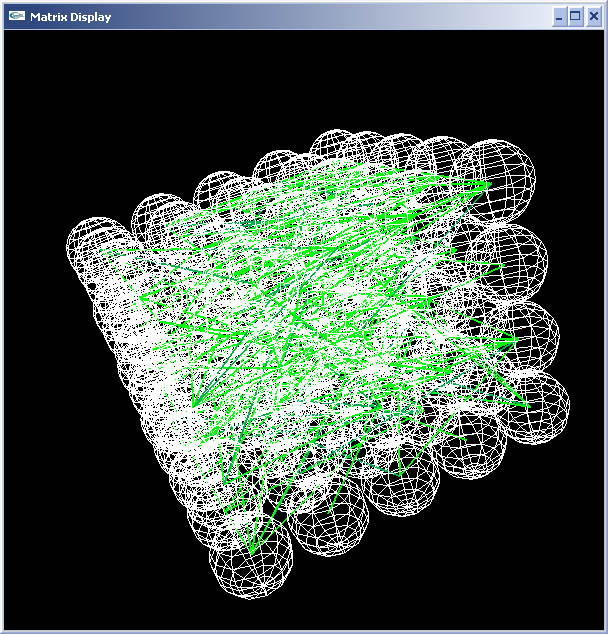
Then I regenerated the same net but this time touched Milo’s antenna, and watched in amazement as neuralogical activity burst to life. It’s hard to tell from this picture, but if you watch it while it’s spinning around you can tell that activity happens primarily along strong links and seldomly along weak links, which is expected in the current scheme:
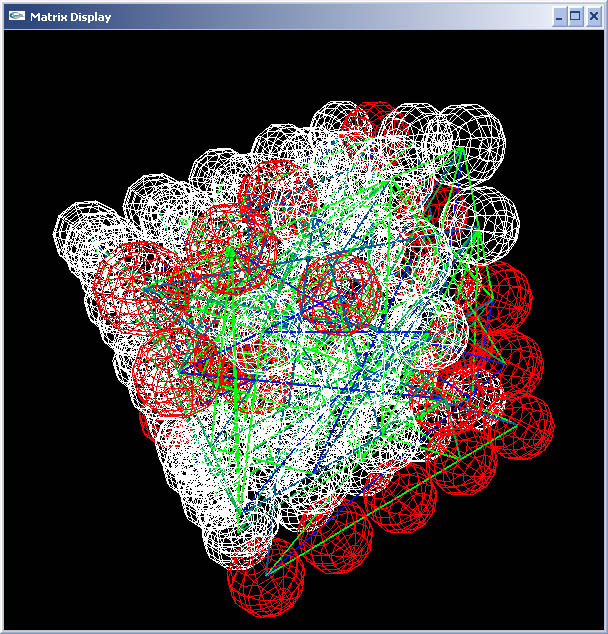
The one problem with the synapse visualization is for anything but small matrices. After a certain point there are so many synapses that it floods the screen, making the visualization not only useless but also extremely slow.
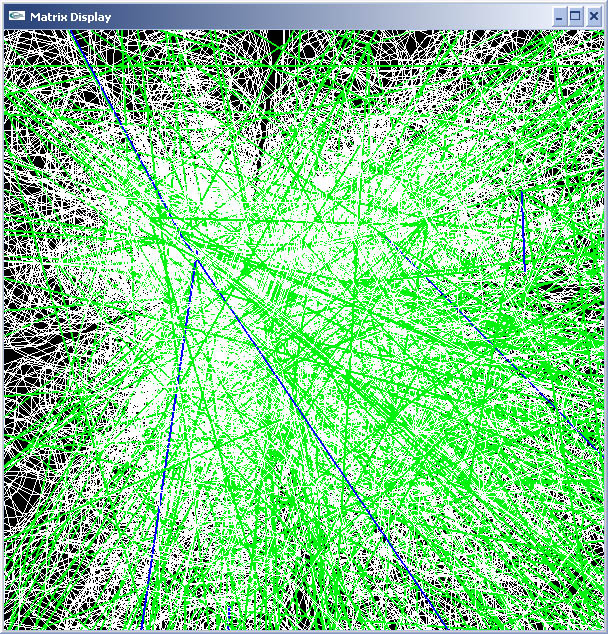
Pretty neat to look at though, for a moment I felt like I was looking at real neurons, it kind of sent a shiver up my back.
Anyway, thanks to the visualization code I can safely say that everything so far is working the way it should be, now onto fixing the synapse modification – very excited!!

