The following graphs demonstrate SynthNet’s substance and electrochemical engine.
For each graph, we have a setup a virtual soma with typical ion concentrations for a Mammalian neuron. Specifically:
Intra/Extra Na: 18mM/145mM
Intra/Extra K: 140mM/3mM
Intra/Extra Cl: 7mM/120mM
Intra/Extra Ca: 100nM/1.2mM
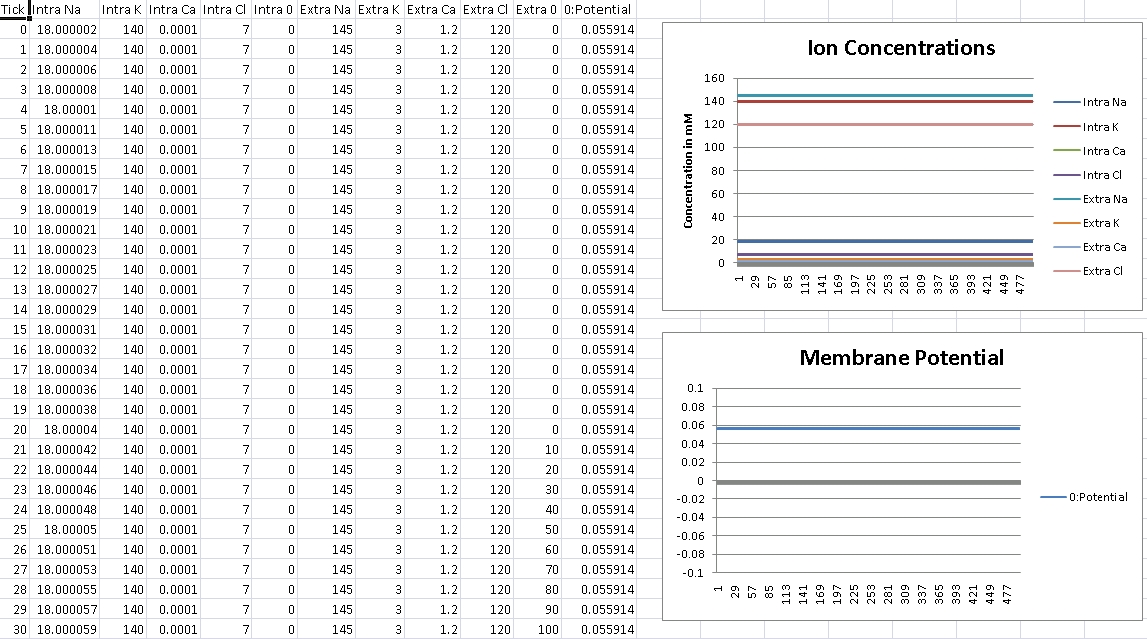
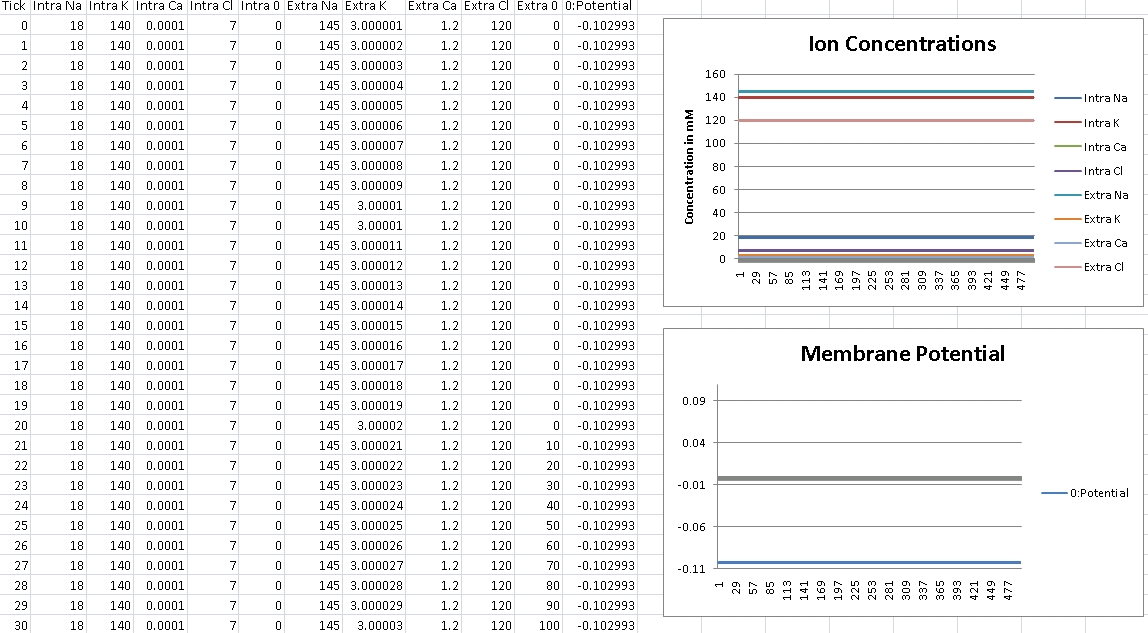
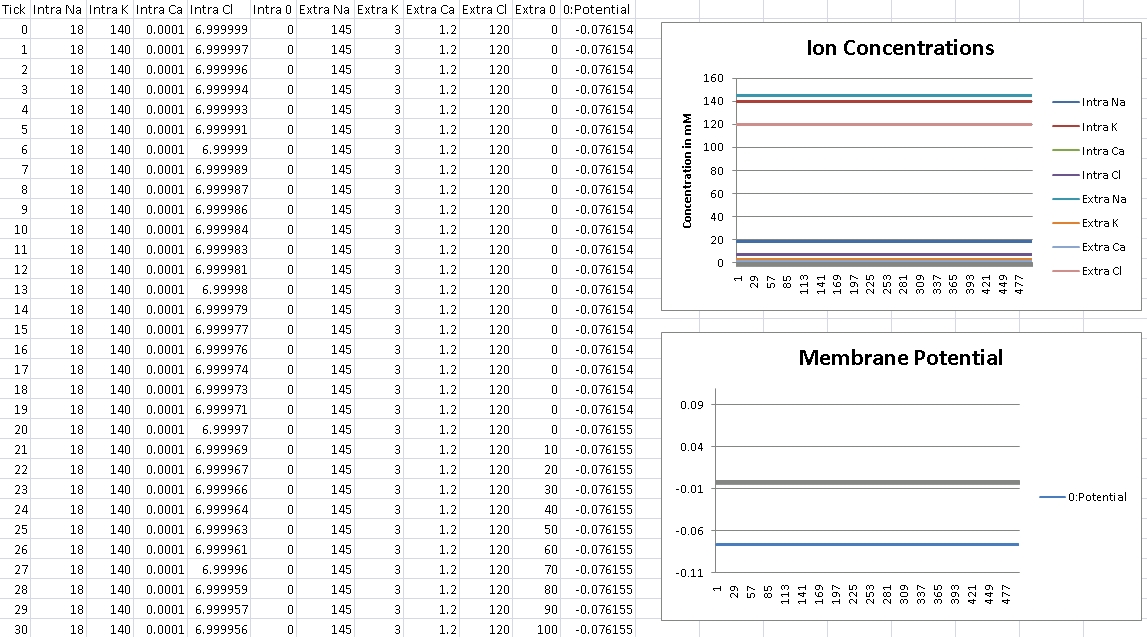
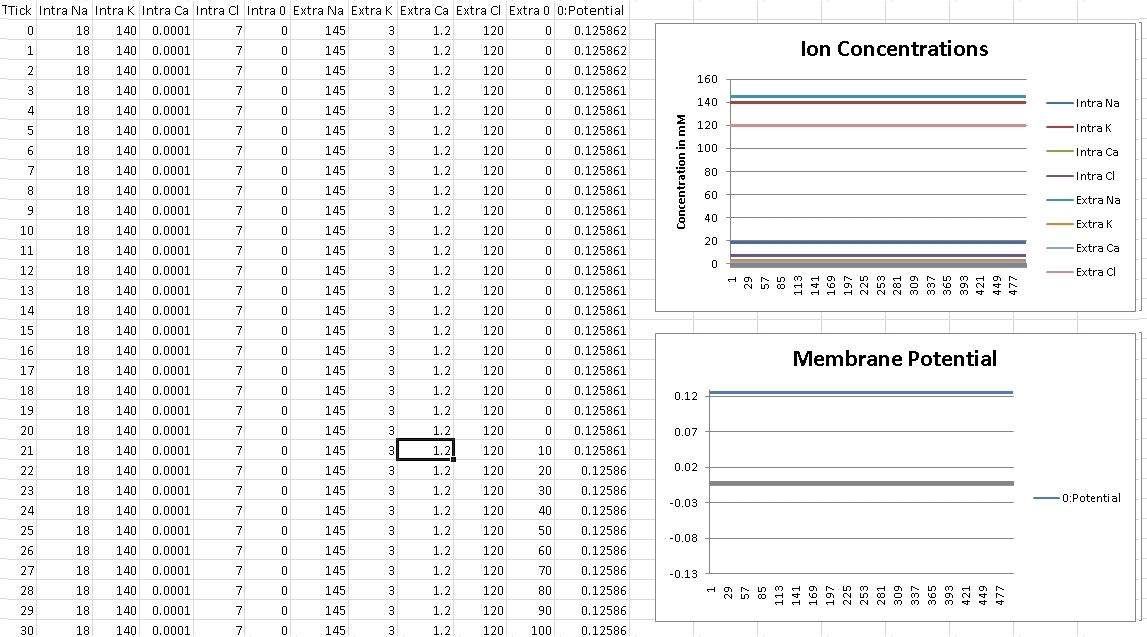
First, we verify that GHK is properly reducing to the Nernst equation and equilibrium potential is correctly being calculated. For this test, we isolate the ion in the question by removing permeability of all other ions across the cellular membrane. We then record membrane potential and ensure it matches equilibrium potential for that ion’s electrochemical gradient.
I forgot to change the scale over, so potential is shown in volts – so remember the factor of 1000 for mV.
For Sodium, we should get +56mV (Verified!)
For Potassium, we should get -102mV (Verified!)
For Chloride, we should get -76mV (Verified!)
For Calcium, we should get +125mV (Verified!)
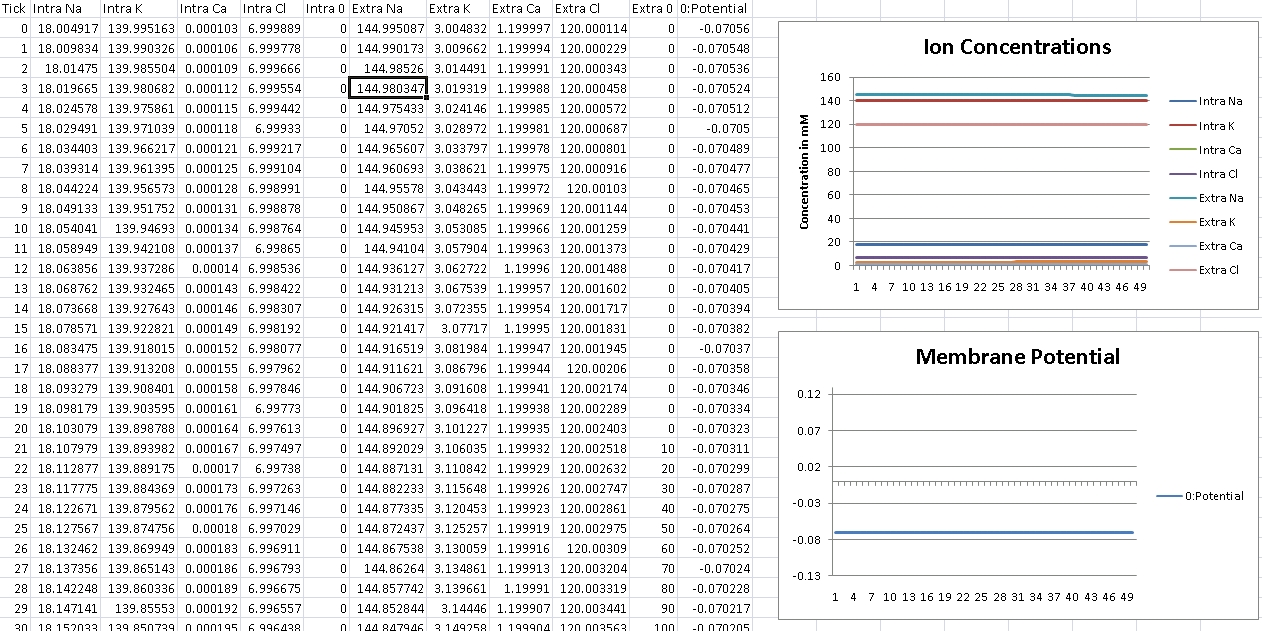
So at this point, we verify that GHK is correctly reducing to Nernst for single ions. Now we need to test that GHK correctly works with multiple ions. So at this point, we setup typical permeability ratios for our neuron. Specifically, Pk:PNa:PCl:PCa = 1.00:0.04:0.45:0.000001.
For these ratios, we should see around -70mV, which is typical for many neurons, including the dorsal lateral geniculate nucleus, thalmus, and close for many others. (Verified!)
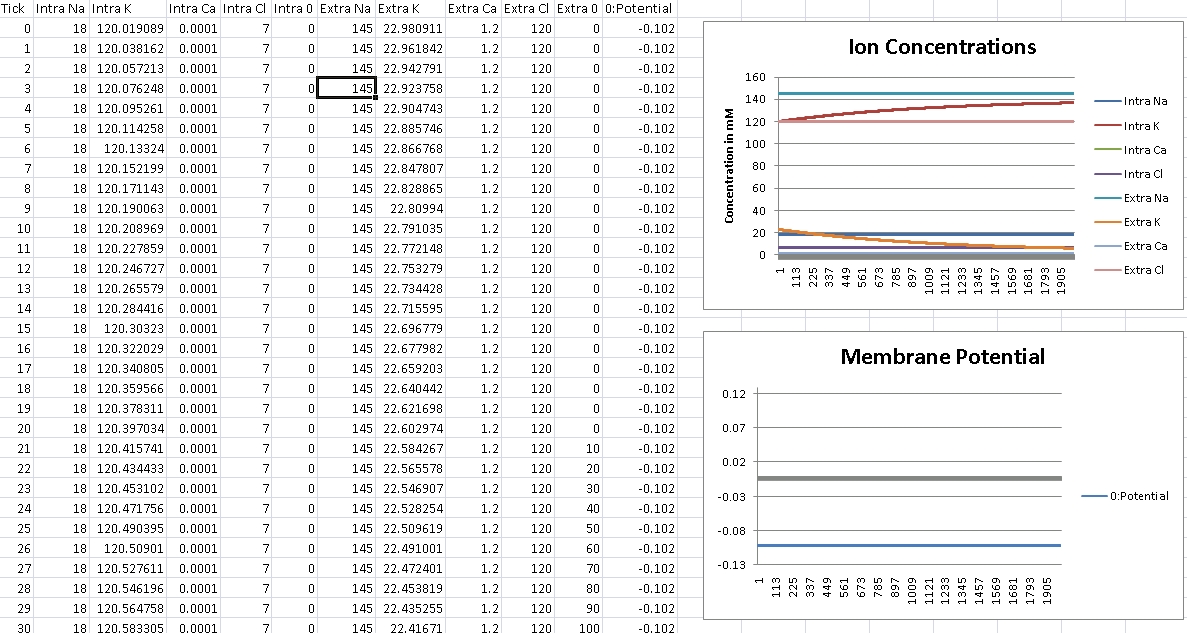
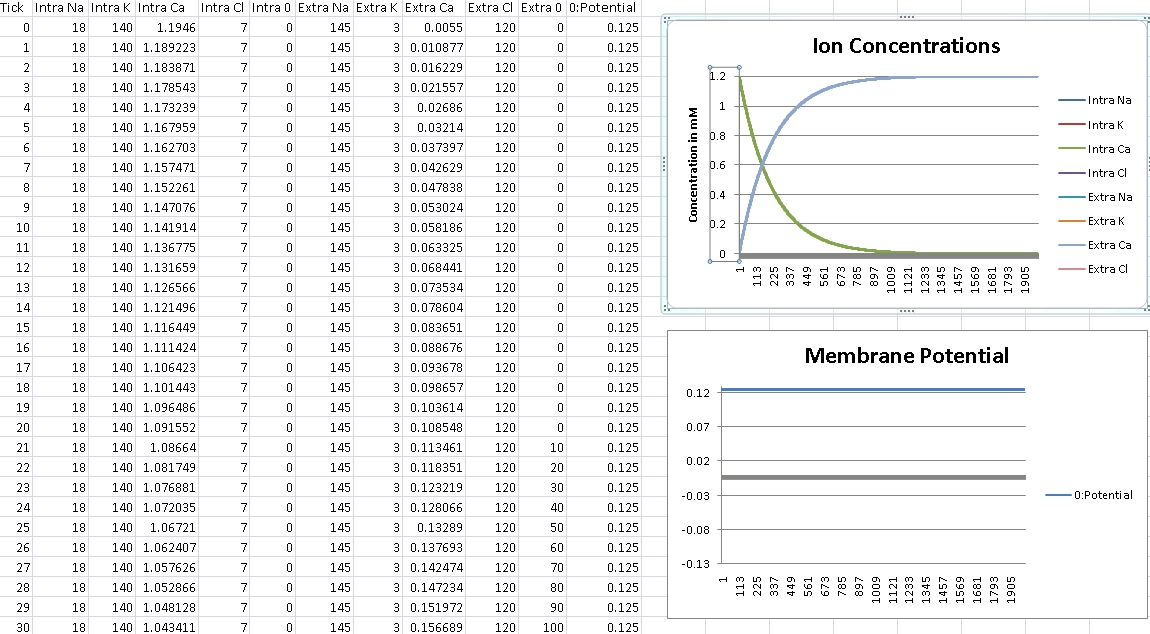
Now, switching over to verifying functionality of GHK flux, we setup an experiment where we again isolate a single ion type, but this time mimic voltage clamping experiments by turning off GHK voltage calculation on our membrane and setting it to a static voltage. We then initiate calculations with the incorrect intracellular and extracellular ion concentrations. If GHK flux is working properly, the ionic concentrations to achieve their respective homeostatic values for the specified membrane potential.
For Potassium, we clamp the voltage at -102mV – we should see concentrations even out at Intra/Extra K: 140mM/3mM (Verified!)
For Calcium, we clamp the voltage at +125mV – we should see concentrations even out at Intra/Extra Ca: 100nM/1.2mM (Verified!)
So ionic flux calculations look spot on too! With both potential and flux working properly, the engine provides enough functionality for the purposes of our emulator (currently, anyway).
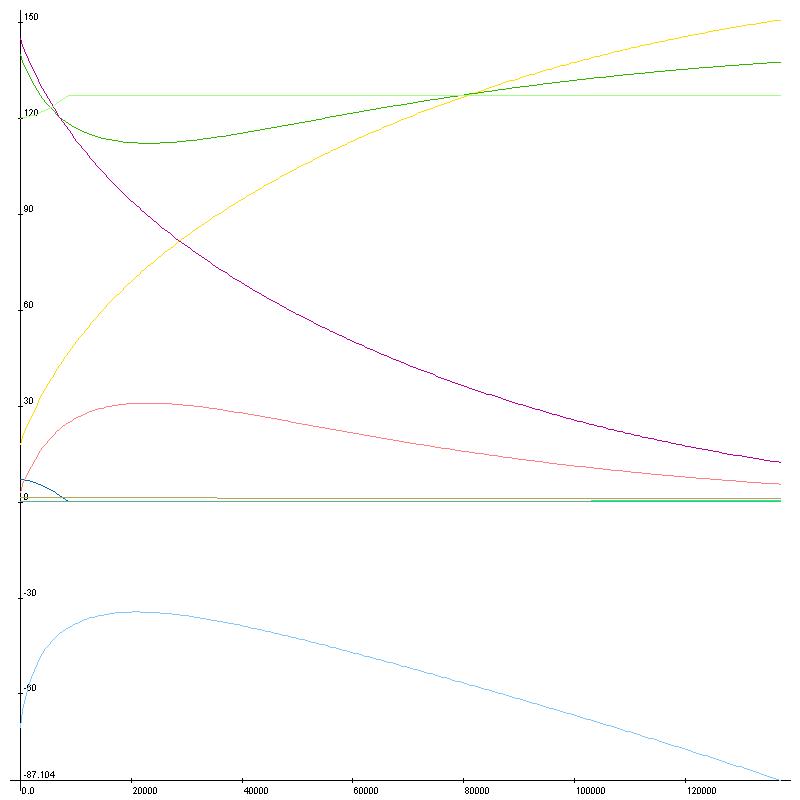
I’ll leave off with a fun graph of running substance calculations over time with no ionic pumps in place to maintain homeostasis. I had to use LiveGraph for this one as Excel doesn’t allow this many graph points, and I don’t know how to turn on the legend – Green/Pink:K, Purple/Yellow:Na, Blue/Cyan: Cl, Ca not really visible, bottom is voltage. Next time I’ll have graphs of action potentials, fun stuff.

